

Sizes, formats and file types
For infographics only. Charts, maps, videos and multimedia content will adjust automatically to the user’s screen size.
▸ Sizes
When you are designing and developing infographics for our sites you must take into account that the infographics will be seen by users using mobiles, tablets and computers with many different screen sizes and resolutions. Our users can use everything in between a mobile with a screen 320 x 480 and a computer with a large 1920 x 1080. The site’s layout will adjust to the screen size of the user, so the infographic must be designed to display as good as possible to all users.
This is not an issue with our site! It’s a feature of modern web design. You must think you design in terms of designing systems, not designing web pages. When done properly it works really well, but it takes a lot of work and some expertise to get it right.
Generic sizes
We are using 4 generic sizes because we want to create infographics that display well in any page in any site.
The javascript code will select one of the sizes after checking the size of the column where the graphic is going to be inserted:
▸ Art boards or pages
Some design programs support art boards, including Adobe Illustrator, Sketch and Figma. Bellow some links to files that will help you start a new infographic. Just download the file for the program you use and start from there.
- Figma - Import file in the file browser
(Please contribute to this section, as this programs require paid licenses)
▸ File types
The relevant filetypes for infographic materials are:
- SVG: For vectorial images. It’s the format that produces images with higher quality on screen and that can be adapted to print.
- PNG: For complex drawings or when SVG does not work well with a specific image. As all bitmap formats it produces blurred images unless the images have exactly the right size. This issue is more obvious in images with text and specific types of infographics. In our site the png format can’t e used in the 545px image because it’s fluid, but it could be used in all the other sizes. In our magazine you shouldn’t use pngs with text as all image sizes are fluid.
- JPG: For photos only. It doesn’t support transparent images, so it’s not that useful for most infographics.
- GIF: For some animations only. It must be avoided when the animation can be done with a video. The .mp4 format is ideal to use in animation videos, but you can use Youtube most of the times.
See also the tests with file formats
SVG
SVGs are the main format to publish infographics in our sites.
About SVG
The SVG format is an excellent format 1, supported by all current browsers and many graphic editing programs. Some of this programs, like for example the popular Adobe Illustrator, export SVG files with a few bugs. When using Illustrator the SVG files need to be properly exported, fixed and the svgs optimised manually by someone that understands how svgs work. It’s also important that the designer knows how to avoid the most frequent bugs.
Test your svgs with different browsers and different screen sizes. Try your SVGs with Chrome, Firefox, Safari, Edge and if possible IE11. You must check that your svgs:
- Are responsive and display correctly in the main families of browsers.
- The fonts are linked from the CSS section and display correctly
- The file size of the svgs is not too large
Ideally your developer should always help to check your SVG's.
Be careful and avoid large file sizes. Optimised SVGs are small, but if you are not careful, they can become quite large. Aim to have SVGs smaller than 200 KB each.
Design with SVG
Please use the fonts Work Sans + Rubik for the site and Merriweather + Source Sans Pro for the magazine. It keeps the infographics design consistent and pages load faster than if you use a different font. More information →
If your infographic has less than 100 characters sometimes it’s a god idea to convert the text to paths (outlines), as it will be easier to insert it in the page. However for infographics with more text this technique will create a heavier file that can’t be edited easily.
SVGs are inserted in the html page using the object tag. Click the previous "code" buttons to copy an example of the responsive html code.
How to export SVGs from Illustrator
In the menu go to File > Save as and save all art boards with the following configuration:
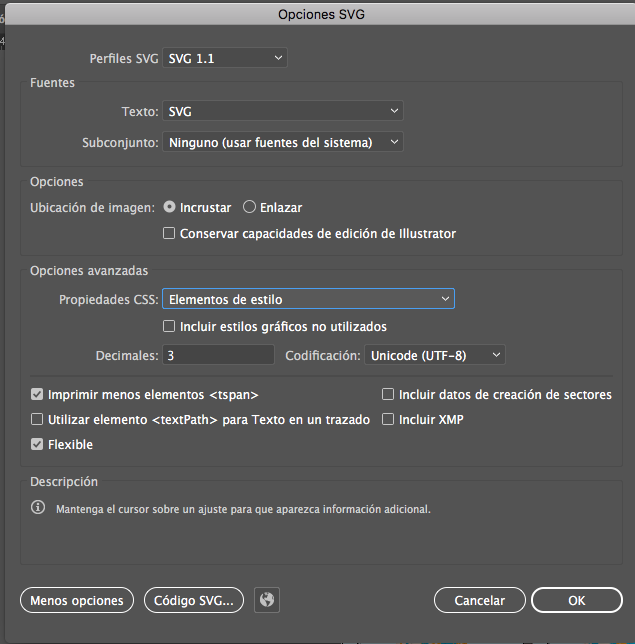
Click to see Adobe's Illustrator export settings
Ai2html vs SVG
Some newspapers are using html instead of SVG to create infographics for the web. And they use the Illustrator Ai2html plugin to convert Illustrator files into html. Other newspapers use svg, and other like the Guardian or Reuters use both.
Our comparison test revealed that published SVG files are editable, can be used to print with higher quality and can have a flexible size.
Although html's purpose is not to create graphics and there's many limitations and inconveniences using it, the plugin might be useful as an alternative for those cases when Illustrator's SVG exports are too buggy. So far we haven't used it beyond the tests.
The main advantages of SVG over Ai2html are:
- Static SVG files can be edited with both Adobe Illustrator and Inkscape. Illustrator is the most popular professional commercial program and Inkscape the most popular open source program. This makes it great to share the infographic files with anyone. And users can remix it, translate it...
- SVGs can be responsive and quickly adapted to other screen sizes.
- Because SVGs are vectorial images, they have enough quality to be adapted and used in print materials.
- Using javascript we can add interactivity or animation to any element in an SVG file.
Whatever the format used, designer and developer must collaborate and test, often from the beginning of the project, specially when we want to use interactivity or animation.